Overall Analysis
Oil gets back in a bull rally with a gap up after the previous session breakdown. Oil continues to rally towards the upside.
Natural Gas continues its rally downside, and Major rejection from the trendline stays intact.
Oil Chart Analysis
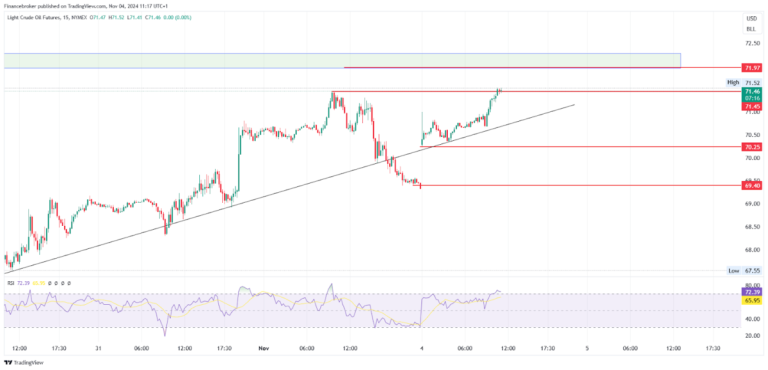
Oil/USD 15-Minute Chart (Source: TradingView)
On the 1st Nov 2024 trading session, oil sustained at a higher level but ended up falling in the second half. The fall broke the major support trendline and indicated more selling.
Currently on 4th Nov today, oil opened a gap up and again entered back in the supporting trendline zone. Price keeps moving up creating higher high and higher low patterns.
On a daily time frame price is currently near the rejection zone. If it fails again, major selling will trigger. The 72 level is crucial for oil if prices fail to break it and sustain above it on a daily time frame. Then selling will continue till 67 levels.
Looking at the chart on the 15-minute time frame indicates the price is sharply moving up towards the rejection area of 71.45. Continued green candles will not support the price to break this level as RSI is also in the overbought zone.
Multiple entries will trigger as mentioned below.
If the price comes towards a supporting trendline and makes a reversal candle, then buyers can enter with a small stop loss below the previous swing low and target for 71.47 and 71.97
If the price rejects from the 71.47 level, comes back and breaks the supporting trendline, then make a selling entry with the previous day’s closing as a target and stop-loss above the previous swing high.
Natural Gas Chart Analysis
Gas/USD 15-Minute Chart (Source: TradingView)
On the 1st Nov 2024 trading session, Natural gas was rejected from the exact rejection trendline and gave targets till 2.6330. Currently, natural gas is in the selling trend.
If we look at the price in a 15-minute time frame, then we can observe from historical data that the price rejects from the resistance trendline and sharply falls after rejecting it.
Currently, Natural gas is indicating a simple trading strategy, where sellers can make a position if the price faces rejection from the rejection trendline and target till 2.6330
If the price breaks the trendline, don’t enter into buying side trade immediately.
The post Oil Rally Resumes Amid Gap Up; Gas Faces Trendline Rejection appeared first on FinanceBrokerage.


